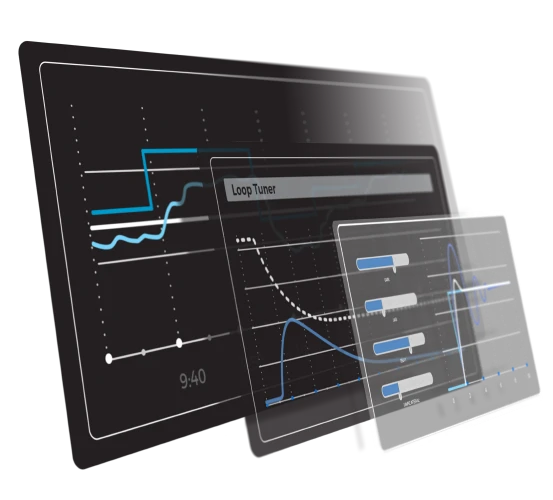
Why CONTROLsuite?
While plants invest significantly in sensors, actuators, control systems, and advanced process control solutions, it is key that the return on these investments is sustained. Today, one third of the process controllers installed operate in manual mode, and on average, one third of the loops in a given facility have equipment problems.
With CONTROLsuite, optimum performance is achievable across all industries and processes. Using CONTROLsuite in a facility will lead to improvement in overall productivity (typically 4 to 8%), in energy consumption (on average 1 to 2%), and in quality of the final product.
CONTROLsuite provides a complete overview of loop performance throughout the entire facility. It identifies and prioritizes the loops that are not performing satisfactorily and identifies the root causes of loop issues. A toolbox for loop tuning is also available.
Impacts all critical success factors

VISIBILITY
- Automated online system.
- Custom daily and weekly reports.

IMMEDIATE ACTIONABLE INFORMATION
- Alerts to service engineers.
- Valve performance alarms.
- Automated email status

HIGH PERFORMANCE
- Focus maintenance efforts where they will have the biggest impact.
- Diagnoses valve mechanical issues like stiction before it becomes a production problem.
- Shift from break/fix to reliability-focused maintenance.
SUSTAINABILITY
- Shorter down times.
- Predictive maintenance and services.
PID Loop Performance Monitoring
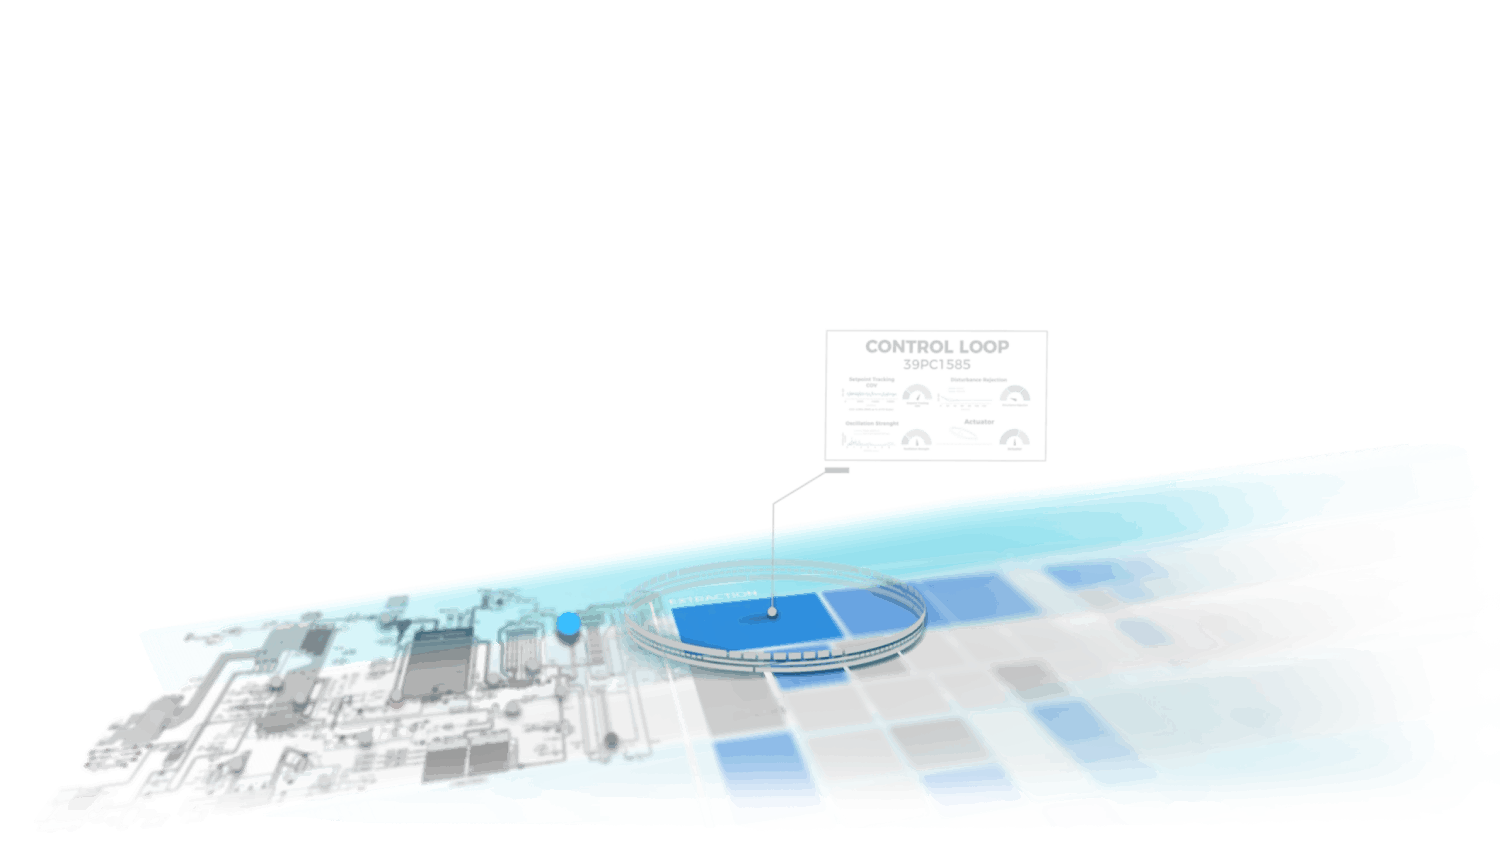
Performance maps
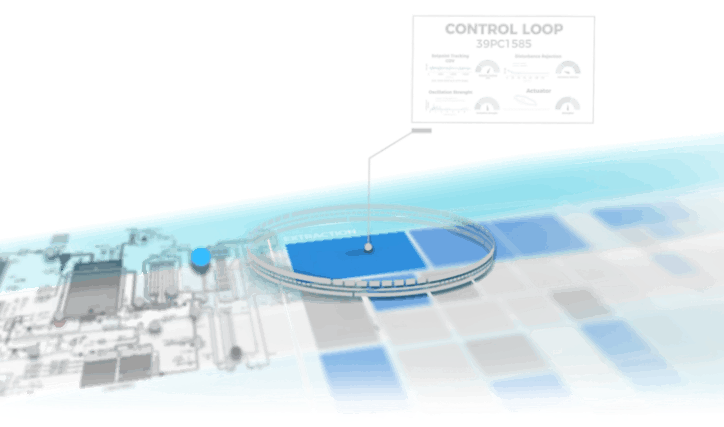
Maps are available to highlight problem loops by process area.
The color and size of the square indicate the severity the problem for a particular Control Loop.
Trends and Reports are readily accessible with a mouse click.
Drill down reporting to find root performance issues.
Enterprise Cloud Integration
Gain detailed visibility of problems at different layered KPIs, across all your organization
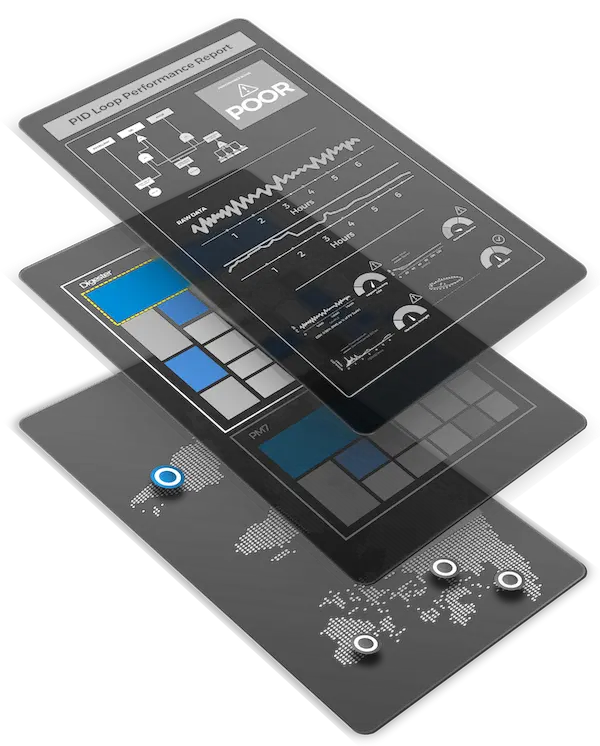
PID LOOP PERFORMANCE REPORT
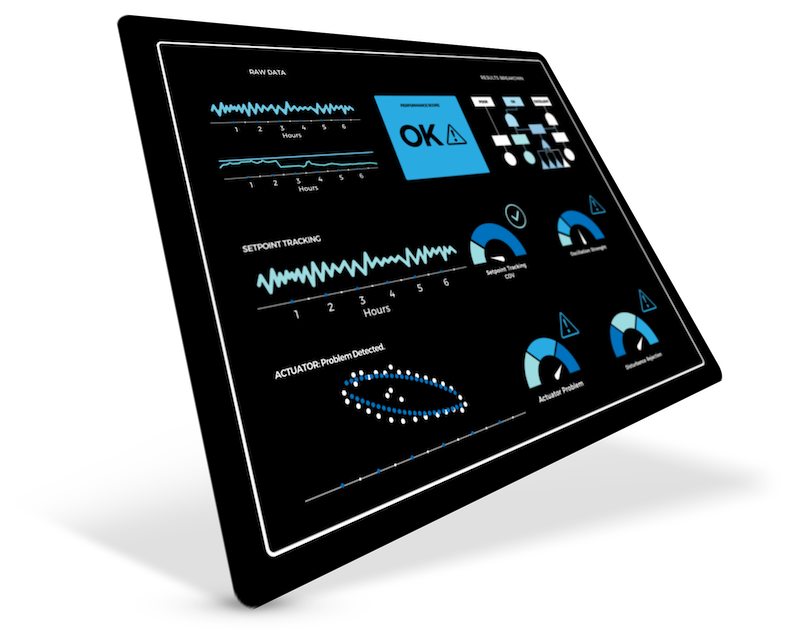
Standard reports shows the overall performance of a loop.
Individual performance indices show the root cause of the loop issue Daily reports received by email.
SITE PERFORMANCE CHART
Site Performance Chart is organized by Process Area.
Individual Colored Squares Represent Control Loops.
The bigger the square the more severe the problems at a particular Control Loop.
GLOBAL PERFORMANCE CHART
Track the control loop performance of your complete organization.
Enterprise reports aggregate loop performance information from all the plants to provide KPIs that allows to identify where most significant performance problems are present. .
Reporting
Standard reports shows the overall performance of a loop.
Individual performance indices show the root cause of the loop issues.
Significant detected problems Reports will be sent by email to key recipients.
Product APIs will allow customers to include query and share KPI or performance data in their own dashboards using available market tools like PowerBI.
PID Loop Tuning
Process modeling
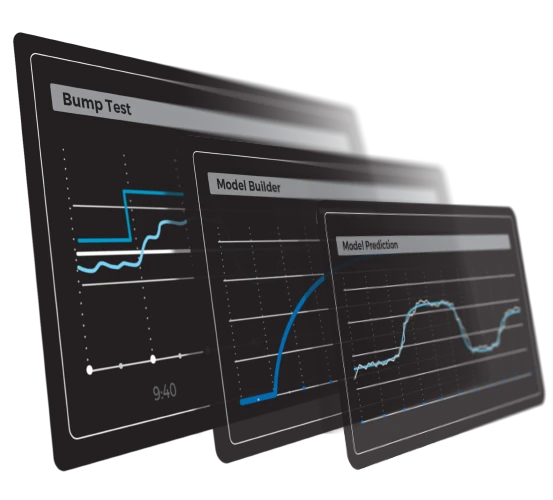
Using advanced algorithms, process modeling leverages precise insights into control loop behavior.
This accuracy leads to more consistent and reliable outcomes when implementing your adjustments.
Tune your loop
Traditional loop tuning often requires skilled personnel and testing periods.
By using CONTROLsuite loop tuning tool you can easily optimize your loops in a fraction of the time, saving money and resources.
The tool will enable the tuning process to be standard across organization, preventing the use of different techniques or approaches based on individual engineers.
